
My contribution
I set up and managed the Google Ads campaigns for Torro Verkeersdienst myself. The screenshots show call ads, search campaigns and campaign views with reach and click data.


Torro Verkeersdienst · Online advertising
Set up and managed by me. A look at the campaigns, reach and cost per click, alongside the original Google Ads screenshots.

Historical account overview
The broad date selection runs from 1 September 2022 to 14 October 2026. The detail screenshots also show the period from 1 September 2023 to 1 September 2024.
Values as displayed in Google Ads, including rounding. The final column measures call clicks; it is not a confirmed count of unique calls, customers or sales.
I set up and managed the Google Ads campaigns for Torro Verkeersdienst myself. The screenshots show call ads, search campaigns and campaign views with reach and click data.
Historical dashboard screenshots, supplied on 14 October 2026. They show advertising costs and recorded interactions. They do not establish revenue, profit or return on investment.
Some screenshots show the same campaign over different periods. The figures are therefore not added together. The visible notices about a paused campaign or deactivated account are also part of that snapshot.
The source screenshots
Seven supplied images, with the key figures also available as readable text. Open a screenshot at full size to inspect the details.
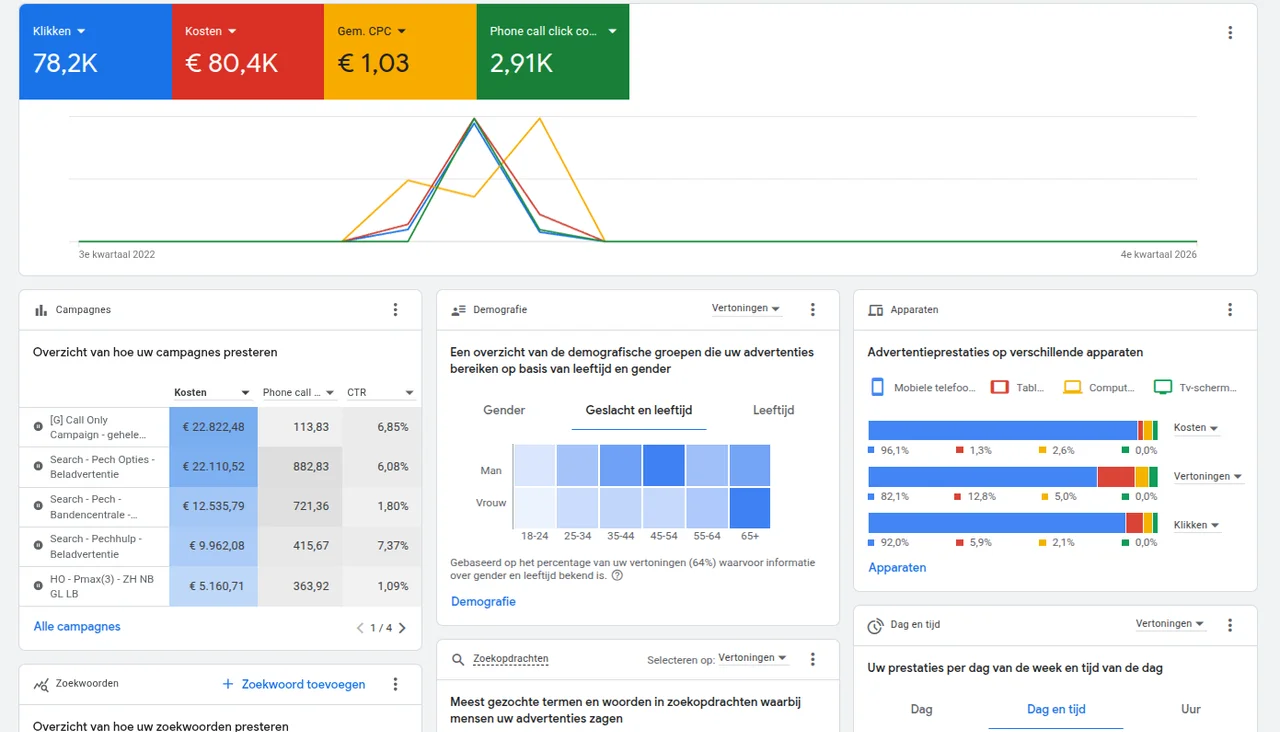
78.2K clicks · €80.4K ad spend · €1.03 average CPC · 2.91K under “Phone call click…”
Longer date selection: 1 September 2022 – 14 October 2026. The exact date bar appears in the corresponding full source image.
 Open full-size screenshot (new tab)
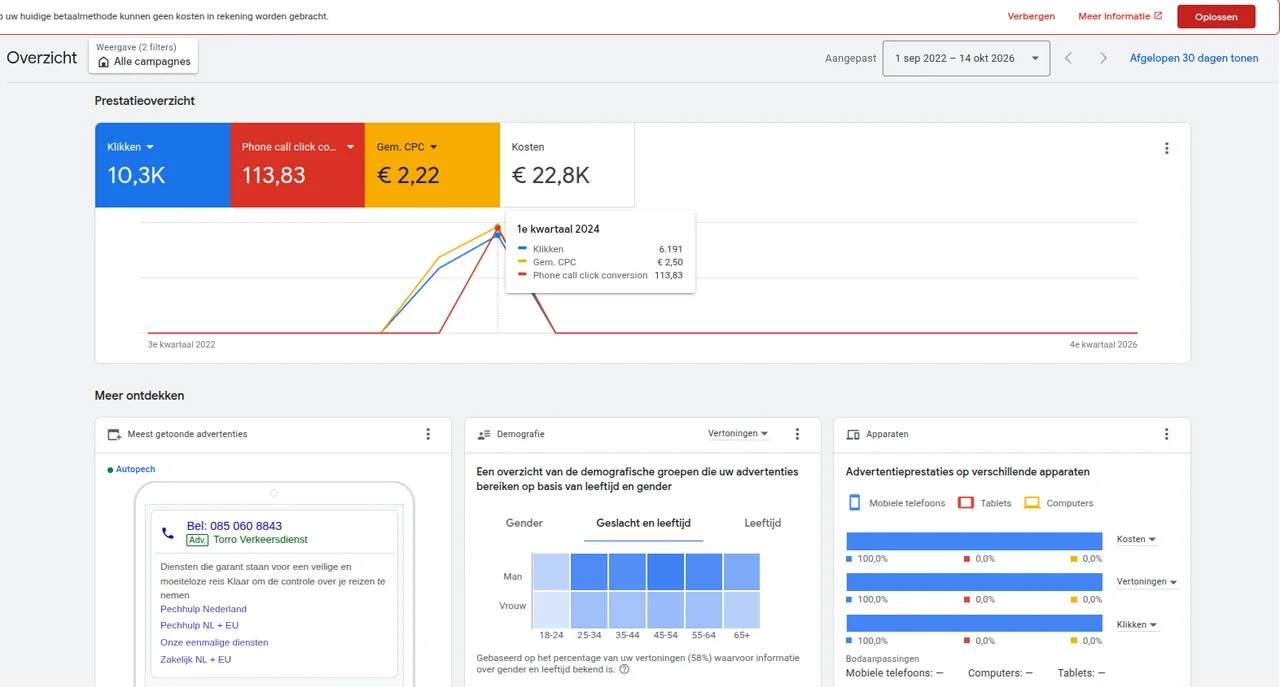
10.3K clicks · €22.8K ad spend · €2.22 average CPC · 113.83 under “Phone call click conversion”
Date selection: 1 September 2022 – 14 October 2026. The tooltip shows the first quarter of 2024.
 Open full-size screenshot (new tab)
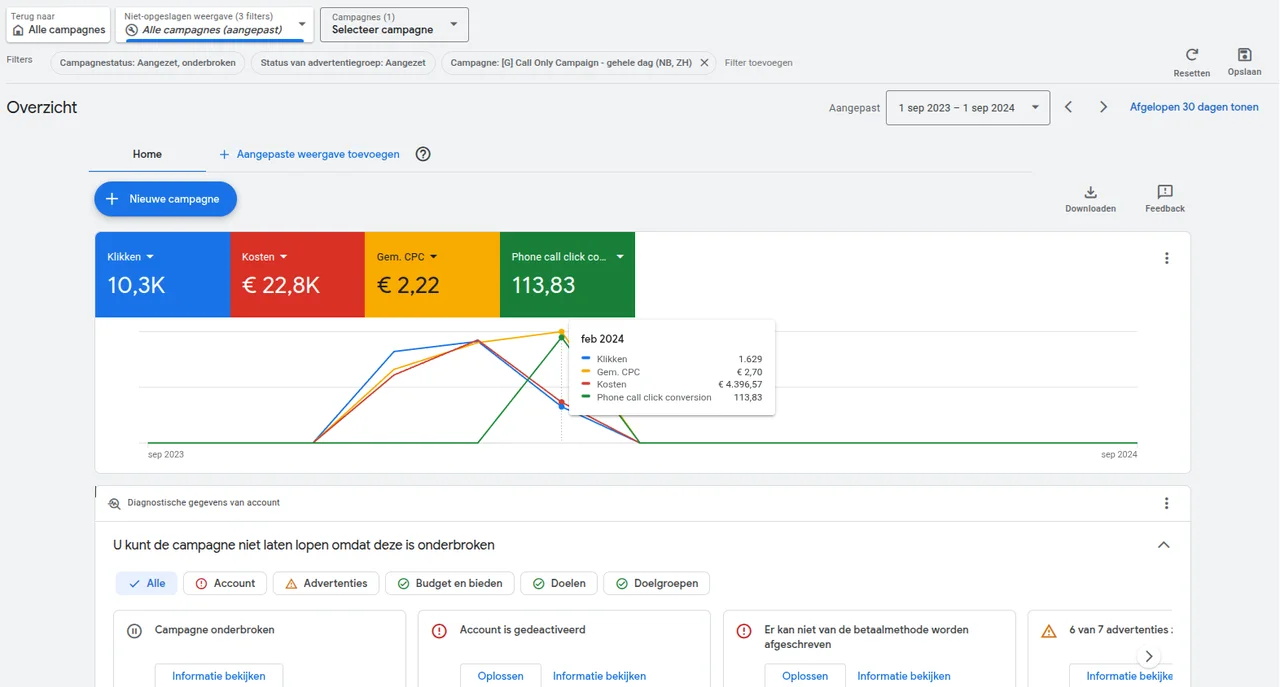
10.3K clicks · €22.8K ad spend · €2.22 average CPC · 113.83 under “Phone call click conversion”
Date selection: 1 September 2023 – 1 September 2024. The same call campaign over a shorter period, with February 2024 in the tooltip.
 Open full-size screenshot (new tab)
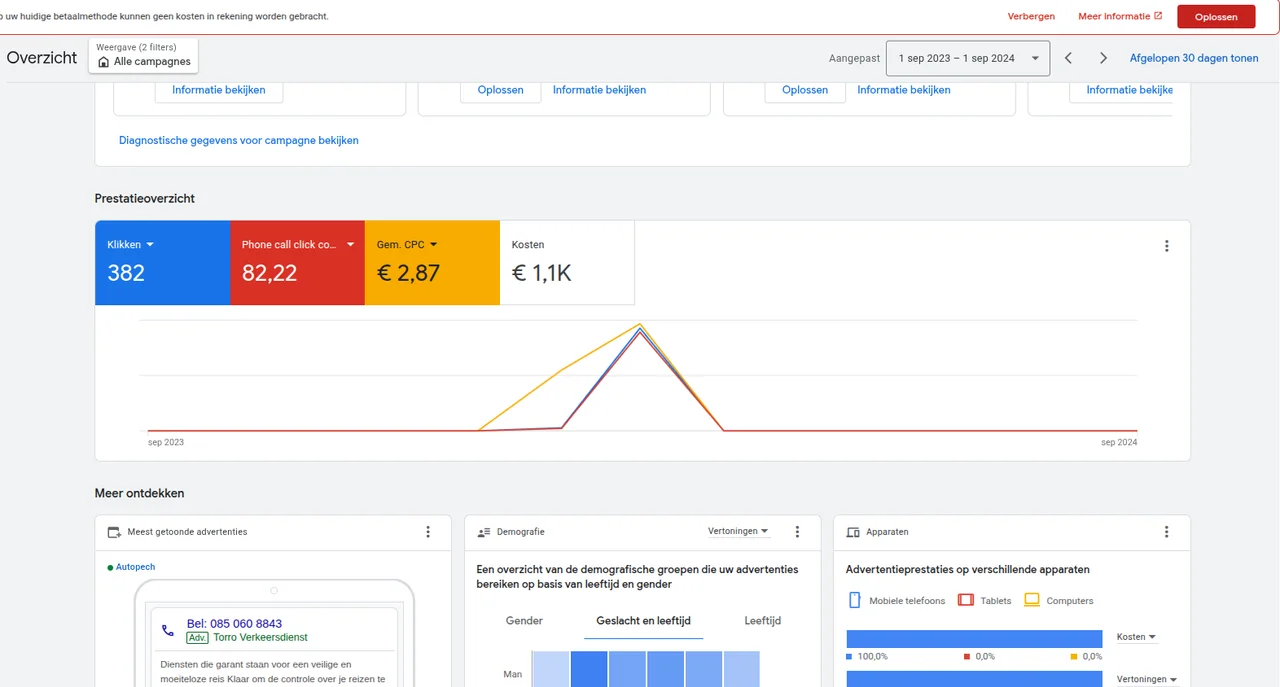
382 clicks · €1.1K ad spend · €2.87 average CPC · 82.22 under “Phone call click…”
Date selection: 1 September 2023 – 1 September 2024. The campaign name is not visible in this image.
 Open full-size screenshot (new tab)
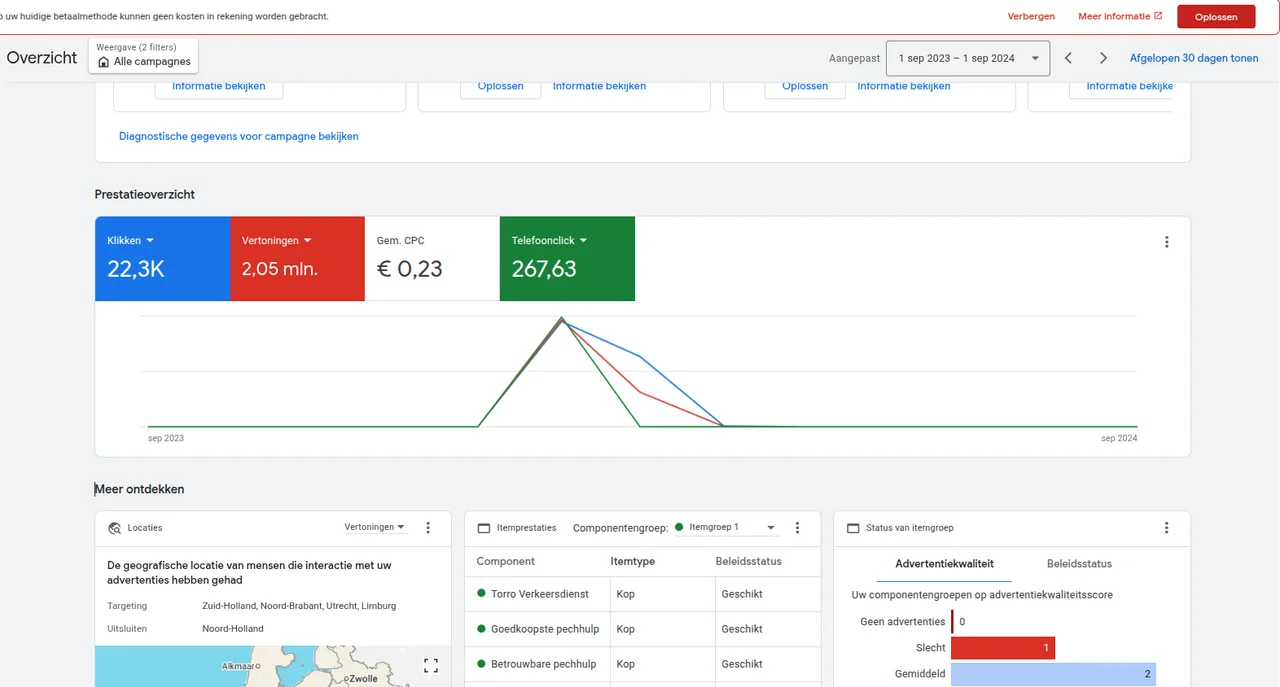
22.3K clicks · 2.05 million impressions · €0.23 average CPC · 267.63 under “Telefoonclick”
Date selection: 1 September 2023 – 1 September 2024. Impressions count how many times the ads were shown.
 Open full-size screenshot (new tab)
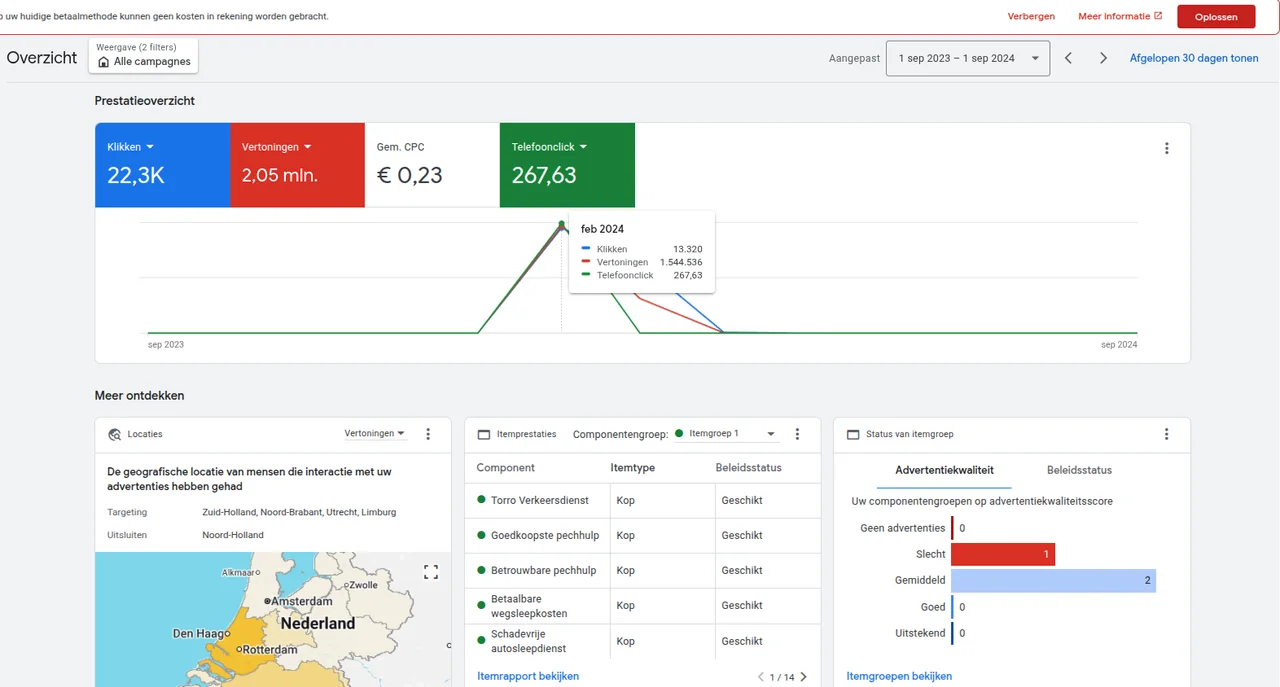
In the tooltip: 13,320 clicks · 1,544,536 impressions · 267.63 under “Telefoonclick”
The same campaign view as “Reach and call clicks”, now with the monthly tooltip. These are not additional results to add together.
 Open full-size screenshot (new tab)
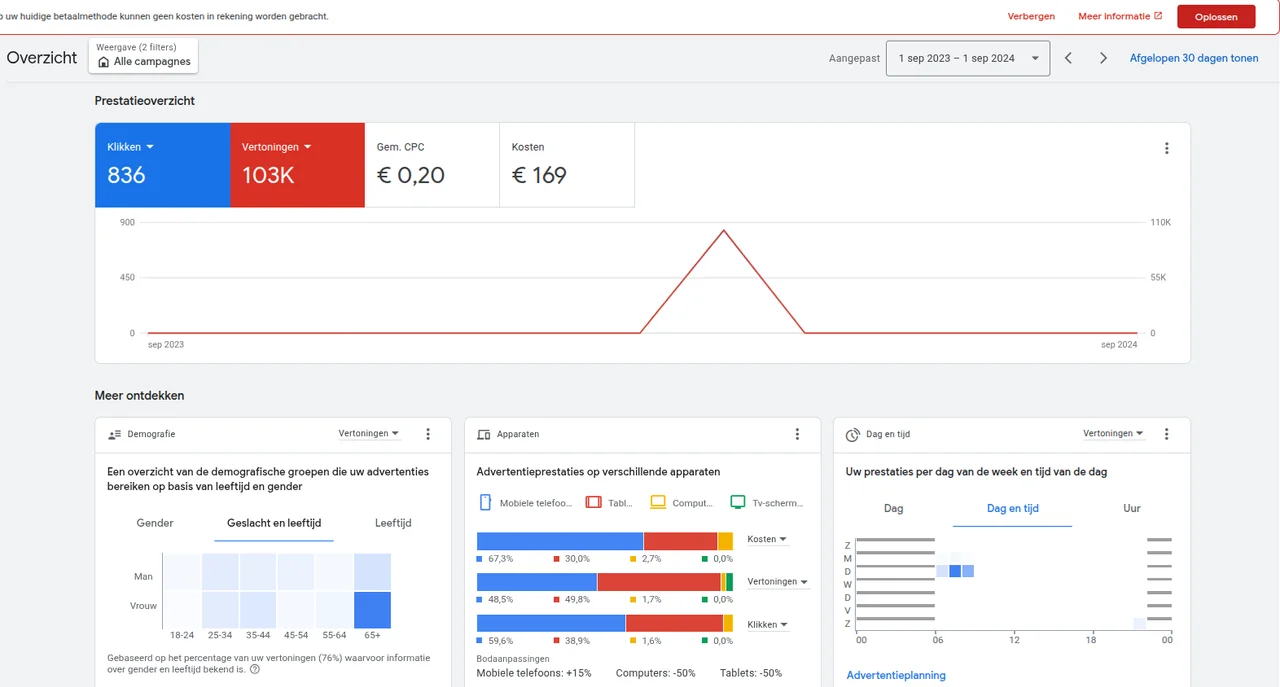
836 clicks · 103K impressions · €0.20 average CPC · €169 ad spend
Date selection: 1 September 2023 – 1 September 2024. The campaign name is not visible in this image.
 Open full-size screenshot (new tab)
Reading the figures
The historical screenshots show activity and costs in Google Ads. They help assess campaign execution. Claims about services sold or return on investment require additional enquiry and customer data.

These figures describe paid traffic and spending within the displayed date range. Compare the same period and scope.
Not every click leads to contact, and not every contact is a suitable customer. Enquiry quality needs to be assessed alongside the advertising figures.
A campaign becomes more focused when you examine the search query, ad and landing page together. This helps identify which part needs further attention.
Personal introduction · 30 minutes
An idea, a bottleneck or a question that is not clear yet. In 30 minutes, we explore where you are and what kind of collaboration fits.
Book an introductionBook your introduction through the calendar.